
[ Jump to the 2024-03-16 update ]
[ Jump to the 2024-03-10 update ]
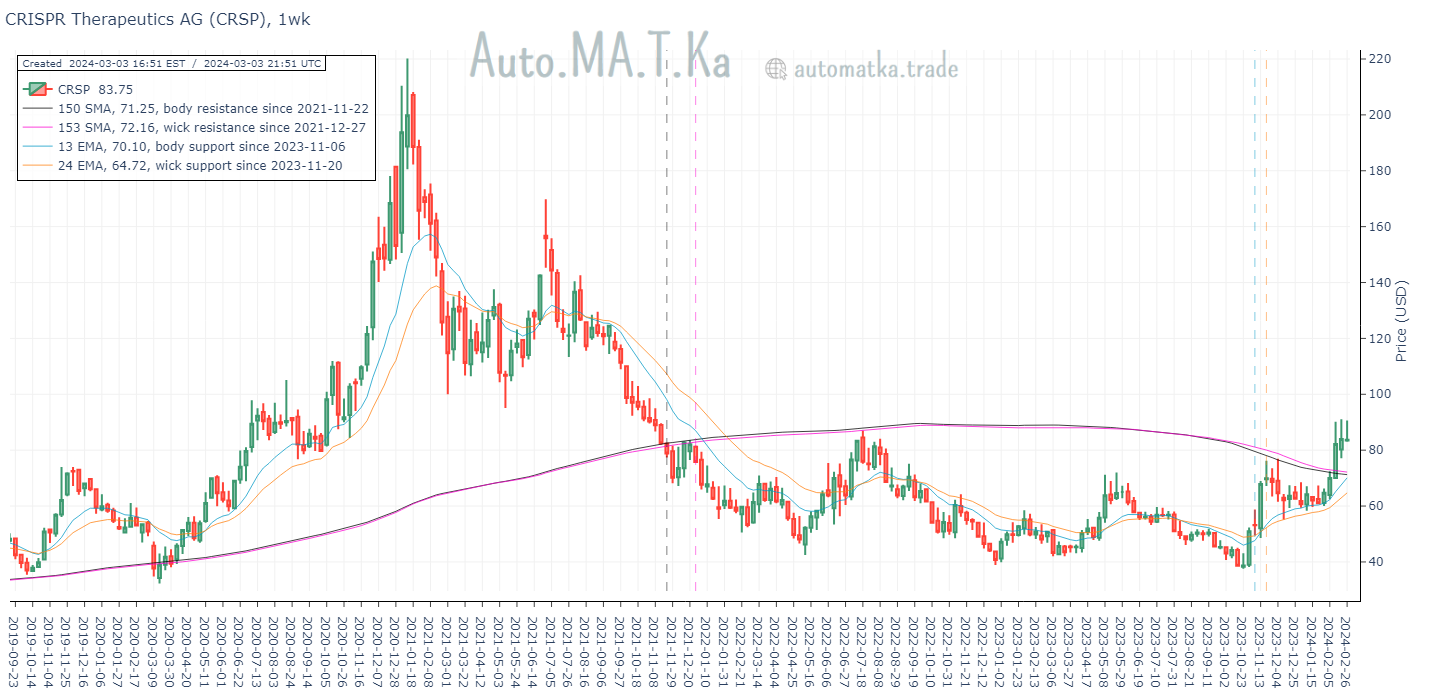
We published our previous post on CRISPR Therapeutics three weeks ago, after CRSP ‘kissed’ its best respected weekly moving average resistance lines, the 150-week SMA and the 153-week SMA, and then set back to close the week at $70.01.
It was the sixth time that the stock had a close encounter with its resistance since November 2021. We wondered whether it was setting up for a break.
Well, on the lucky number 7, CRSP delivered.
The following day CRSP began its huge move up, and within four days it hiked 28.81% to a price of $90.18.
Against buyers’ wishes, CRISPR Therapeutics’ stock could not break that level. In the last three weeks sellers rejected any attempt to trade the stock higher than the $90 area:
If sellers win the current price battle and push the stock down, CRSP’s price may find two potential support areas:
- The once-resistance-now-support area, defined by the 150-week SMA and the 153-week SMA lines.
- The best respected moving average support lines: the 13-week EMA and the 24-week EMA lines.
Since the last huge move in November 2023, CRSP has been respecting the 13-week EMA and the 24-week EMA lines. The 13-week EMA line is about to cross above the 150/153-week SMA line. We’ll pay attention to the price action around this MA line. You might want to do the same.
2024-03-10 Update
One week has gone by and the 13-week EMA crossed above the 150-week SMA. CRSP closed last week at $78.92:

2024-03-16 Update
It took one more week for CRSP to reach the 150/153-week SMA and 13-week EMA support area:

Zooming in:

This is an interesting junction: Will CRSP bounce from here or break support?