Moving Average Calculations
A moving average value can be calculated on a series of data points in different ways; however, there are two commonly used calculation types used by stock market participants and by stock charting software:
- A simple moving average (aka MA and SMA)
According to Investopedia: “In statistics, a moving average is a calculation used to analyze data points by creating a series of averages of different subsets of the full data set. In finance, a moving average (MA) is a stock indicator that is commonly used in technical analysis” (source). - An exponential moving average (aka EMA)
According to Investopedia: “An exponential moving average (EMA) is a type of moving average (MA) that places a greater weight and significance on the most recent data points” (source).
[On its website, in pages pointed by the above source links, Investopedia provides full descriptions, including calculations, formulas, and examples for both SMA and EMA]
Investopedia explains that “The reason for calculating the moving average of a stock is to help smooth out the price data over a specified period of time by creating a constantly updated average price” (source).
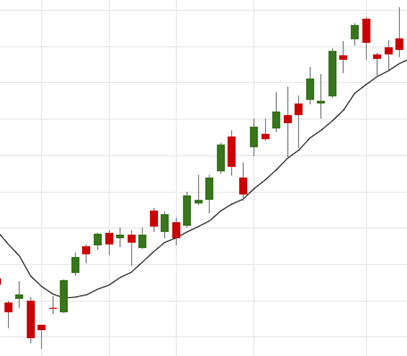
Connecting the moving average values by a line and plotting it as an overlay on top of a stock (or any other asset) price chart, helps market participants visualize a relatively smooth price movement of the stock, while toning down ‘noise’ that is created by isolated, scattered, or sporadic price changes along the time axis. Figure 1 shows an example of a 21-period exponential moving average (EMA) line, overlaid on top of a daily price candle chart of the SPY Exchange Traded Fund (ETF) asset.

Usage of Moving Averages in the Stock Market
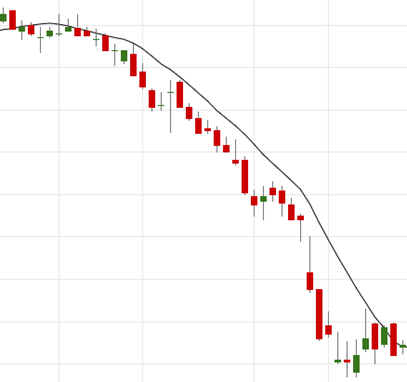
Moving average lines are often used by market participants as support and resistance lines that help them make trading decisions. For example, if an asset price is traded above (or below) a moving average line for a certain period of time, it can indicate that the price is supported (or resisted) by the line, and therefore the asset can still be held long (or can still be shorted) for an additional potential upside (or downside). A visual illustration for that can be seen in Figure 2, where the price candles on the left side are plotted below the 8-period exponential moving average line, and the price candles on the right side are plotted above the 8-period EMA line. Another example is when the asset price crosses the moving average line. A cross of the asset price from below the line to above the line can indicate an entry point (buy signal) while a cross of the asset price from above the line to below the line can indicate an exit point (sell signal). That example as well is illustrated in the center of Figure 2, where the price candles cross from below the moving average line to above the line and trigger a buy entry (or exit a short position).

It is not uncommon to see an asset price trade up above (or down below) a moving average line for a meaningful time series, as seen in Figure 2. At times, the price gets closer to the line only to touch it
or to shortly pierce it, before bouncing back to continue its original trend. We refer to this phenomenon as “price respects the moving average (support/resistance) line.” Clearly in these situations, it is not that the price bounces off the line like a tennis ball bounces off a wall due to the laws of physics. The phenomenon is caused by a confluence of market participants that continuously watch the price fluctuations and act when the price nears the moving average line. Figure 3 and Figure 4 show
examples of the phenomenon.
A moving average line can be calculated using any N periods, or past data points, as long as the number of data points available in the dataset ≥ N. And yet, for plotting support and resistance lines, market participants commonly use a basket of N values for both SMA and EMA lines. A few examples of these periods include (but not limited to): 5-period SMA, 8-period EMA, 9-period EMA, 10-period SMA, 20-period SMA, 21-period EMA, 30-period SMA, 50-period SMA, and 200-period SMA.
Challenges
There are five main challenges with the commonly used approach:
- The determination which of the commonly used N values forms a respected N-period MA line.
In other words, how can one tell which MA period is the one that a stock respects? - The N value of a respected N-period MA line may not be a commonly used N.
For example, in Figure 5 DM respects the 108-day EMA and the 127-day EMA as body and wick resistance lines respectively. 108 and 127 are not commonly used periods.
Figure 6 shows AMD on a 5-minute chart; the respected resistance lines are the 343-period SMA (body) and the 355-day SMA (wick) lines. These periods are far from being commonly used.


- An N-period MA line that is respected by one asset may not be respected by another asset, i.e., the data points (prices) of various assets respect different MA lines.
This can contribute to having market participants use an underfitted or overfitted moving average line for a given asset. An example for such a case is a trader that has her charting software automatically plot the 8-period EMA line and the 21-period EMA line for every stock symbol that is loaded on the chart. Figure 7 and Figure 8 visualize this challenge.


- For a given asset, a respected N-period MA line may no longer be respected when the time interval used to plot the chart changes.
In the following example, AMZN respects the 21-period EMA support line on a daily chart. However, when the chart is changed to use a 1-hour interval, the 21-period EMA no longer acts as a support line. AMZN on the hourly chart respects the 140-period EMA support line.


- Over time, an asset may shift from respecting an N-period MA line to respecting an N-period MA line that has a different N value. I.e., A stock may respect its 43-period EMA on a daily chart during January and may shift to respect its 67-period SMA in February. Figure 11 visualizes this challenge.

Addressing the Challenges
If we had to compress all the aforementioned challenges into one sentence, a good candidate would be: “One size does not fit all.”
Auto.MA.T.Ka addresses these challenges by automatically finding the best respected moving average line(s) for a given asset, at a given time, within the provided time interval and sample size.
With any change in one or more of the input parameters – the symbol, dates, sample size, interval – our algorithm updates its output with the best respected moving average line(s) to fit the new parameters.