This page includes information and reference that may provide additional value when learning about Auto.MA.T.Ka. The page is laid out in a Q&A format. If you have a question that is not answered here please send it to us via the Contact Us page.
Table of Contents
- What does ‘respected’ mean in ‘best respected moving average line’?
- What are the four (4) moving average lines plotted on a chart?
- Why is it that some charts are plotted with four (4) moving average lines while others are plotted with fewer lines?
- What are the vertical dashed lines plotted on the charts?
- How is the value of a moving average calculated if the last/current candle (bar) is still being built within its interval (i.e., the last candle is incomplete/in-progress/active/open)?
- How accurate are the moving averages when acting as support and resistance lines?
- Are all support/resistance lines equal?
- What are the elements included in the information box located on the top-left corner of the chart?
☛ What does ‘respected’ mean in ‘best respected moving average line’?
It is not uncommon to see an asset price trade up above (or down below) a moving average line for a meaningful time series. At times, the price gets closer to the line only to touch it or to shortly pierce it, before bouncing back to continue its original trend. We refer to this phenomenon as “price respects the moving average (support/resistance) line.” The following example shows Microsoft (MSFT) on a daily chart, bouncing off its moving average line that acts as support for nearly 6 years:

Clearly in these situations, it is not that the price bounces off the line like a tennis ball bounces off a wall due to the laws of physics. The phenomenon is caused by a confluence of market participants that continuously watch the price fluctuations and act when the price nears the moving average line.
☛ What are the four (4) moving average lines plotted on a chart?
For a given symbol and time frame, Auto.MA.T.Ka‘s algorithm fits the 4 best respected moving average lines:
- Wick support line: considering the low prices represented by the candles/bars.
- Body support line: considering the lower of open vs. close prices represented by the candles/bars.
- Wick resistance line: considering the high prices represented by the candles/bars.
- Body resistance line: considering the higher of open vs. close prices represented by the candles/bars.
These four lines are seen in the following Zendesk (ZEN) example:

☛ Why is it that some charts are plotted with four (4) moving average lines while others are plotted with fewer lines?
Although our algorithm is configured to fit 4 moving average lines (2 support + 2 resistance), not always does the analyzed symbol respect 4 moving average lines within the given parameters. For example, a declining stock may respect a wick and body resistance lines on a daily chart, however, it may not have any moving average line it respects as support within the analyzed sample size (period). Demonstrating this example is Desktop Metal (DM) in the following chart:

☛ What are the vertical dashed lines plotted on the charts?
A vertical dashed line, which is color-coded to match the color of a plotted moving average line, marks the timestamp on the x-axis where the asset’s price started respecting the corresponding moving average line. Multiple lines could be stacked on top of each other if their timestamps are identical (as can be seen in the Desktop Metal example above).
☛ How is the value of a moving average calculated if the last/current candle (bar) is still being built within its interval (i.e., the last candle is incomplete/in-progress/active/open)?
It is possible to configure our algorithm to include or exclude data from an incomplete candle (bar) when finding the best moving average line and when plotting it on a chart.
A configuration to include data from an incomplete candle (bar) may impact the algorithm’s result if the asset’s price fluctuates in a range that makes a difference in calculations. For example, an incomplete weekly candle may show an asset’s last price of $50 on Monday, and $55 on Friday. As the asset’s price is one of the input parameters used by the algorithm, the calculated output and chart plot on Monday will be different compared with the output on Friday.
We chose to configure our algorithm to use the closing (last) prices of completed candles (bars) only, i.e., if a candle is still being built then it is not included in the calculation.
This configuration affects the value of the moving average line plotted for the last/current candle if it is still incomplete. In that case, we copy the moving average value from the value calculated for the last completed candle (bar). In this manner it is possible to see what the incomplete candle (bar) is up against.
Here are 2 examples:
- The moving average lines plotted on the Bilibili (BILI) monthly chart are seen turning horizontally from March 2022 to April 2022. This is because the calculation was performed while the April candle was incomplete and data from the last candle (April) was excluded. Therefore, the moving average value for April 2022 is copied from the moving average value for March 2022:

- The SunOpta daily chart shows the benefit of visualizing the moving average value of the last completed candle (bar) while the current candle (bar) is still being built (incomplete):

☛ How accurate are the moving averages when acting as support and resistance lines?
Support and resistance lines should not be treated as an accurate science that persistently works to the cent. Rather than getting hooked on the specific prices the lines represent, a wiser approach would be to treat them as areas of support and resistance. These areas help pointing out places or price points where market participants may be inclined to take actions. Always remember that support/resistance lines may hold or break.
☛ Are all support/resistance lines equal?
An asset’s (e.g. a stock) price may have a single or multiple touch/proximity point(s) with a best respected moving average line. The more times the price bounces off a moving average line, the stronger the line is when acting as support/resistance. It is natural to assign a greater confidence score to a line when there are multiple touch/proximity points compared with a line with a single touch point.
☛ What are the elements included in the information box located on the top-left corner of the chart?
The information box appears on the top-left corner of each chart. Here is an example:
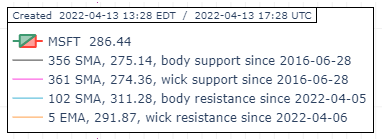
Explanation:
- The first line from the top shows the timestamp of the performed calculations and chart creation. It is displayed in both United States Eastern timezone and UTC timezone.
- The second line displays the asset’s traded symbol and its last price at the time of data capture.
- The next 1 to 4 lines display the best respected moving average lines in the following format:
<Line color> <Moving average period> <Type of moving average (SMA/EMA)>, <Moving average current value>, <Element of candle (bar) respecting the line (body/wick)> <Line acting as (support/resistance)> since <Timestamp the line started being respected>