We’ve been watching the 10-Year treasury note yield (TNX, ^TNX) since March 2022.
The question “when will the rate go down?” was answered in our July post.
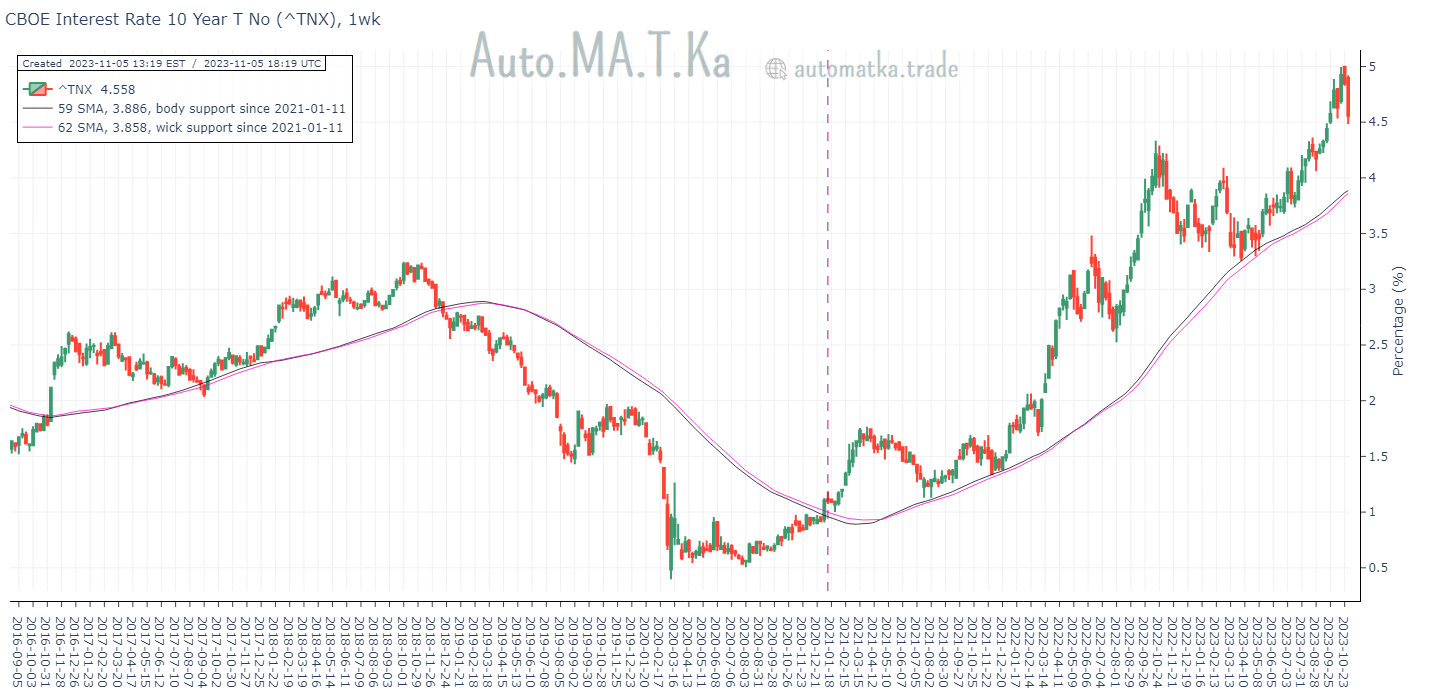
As the charts keep showing, the 59-week SMA and the 62-week SMA lines are still the active supporters of the yield since January 2021:
Zooming in:
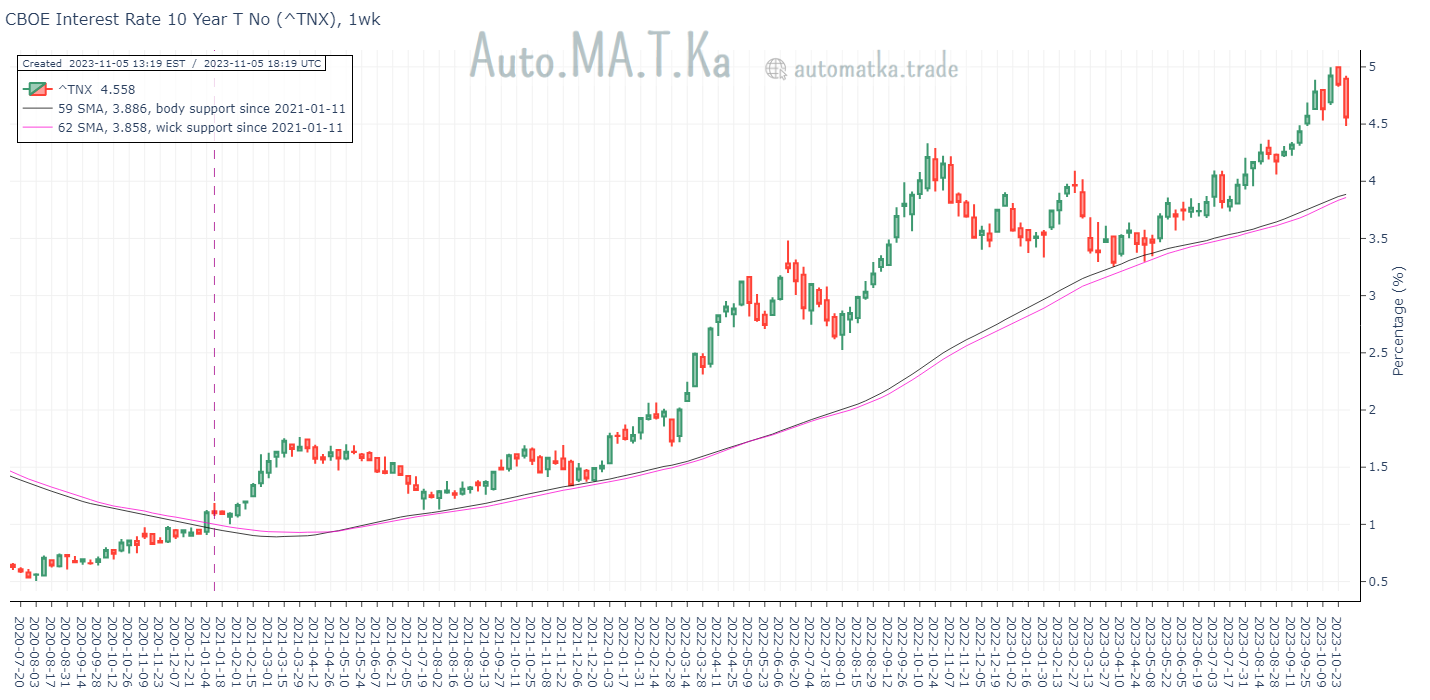
One day, not too far out, the yield and the support lines will meet again. In all previous encounters since January 2021 the support lines held firm and the yield bounced back up. With the current economic atmosphere, the next encounter has the potential to disrupt the previously observed behavior pattern.
Stay tuned.