[ Jump to the 2023-07-02 update ]
[ Jump to the 2023-07-02 update ]
[ Jump to the 2023-06-25 update ]
[ Jump to the 2023-06-11 update ]
[ Jump to the 2023-06-04 update ]
[ Jump to the 2023-05-29 update ]
In our post last week we showed how Netflix’s stock, NFLX, started breaking above its best respected moving average resistance lines on both daily and weekly time frames.
In the last weekly trading session, NFLX confirmed that break out.
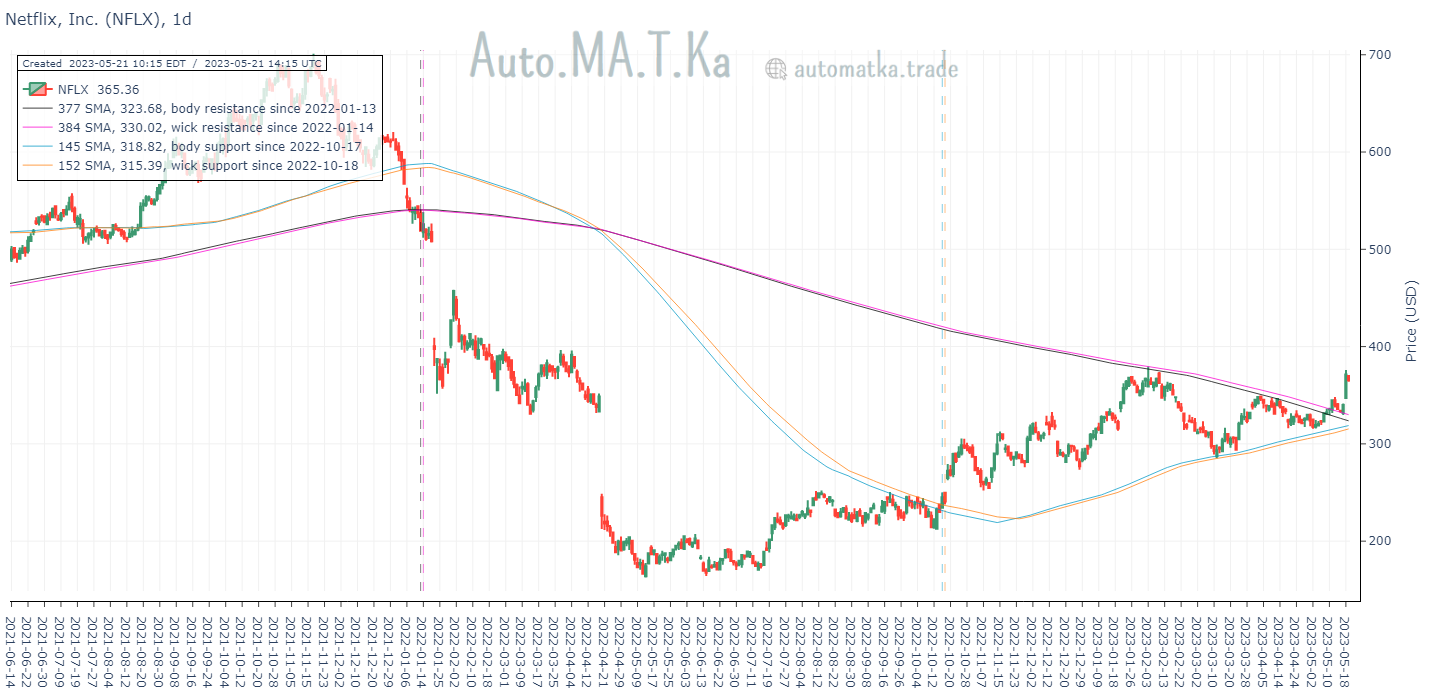
Let’s look at the daily chart, overlaid with the best respected moving average support and resistance lines that were found on Monday, 8 May 2023:
Zooming in:
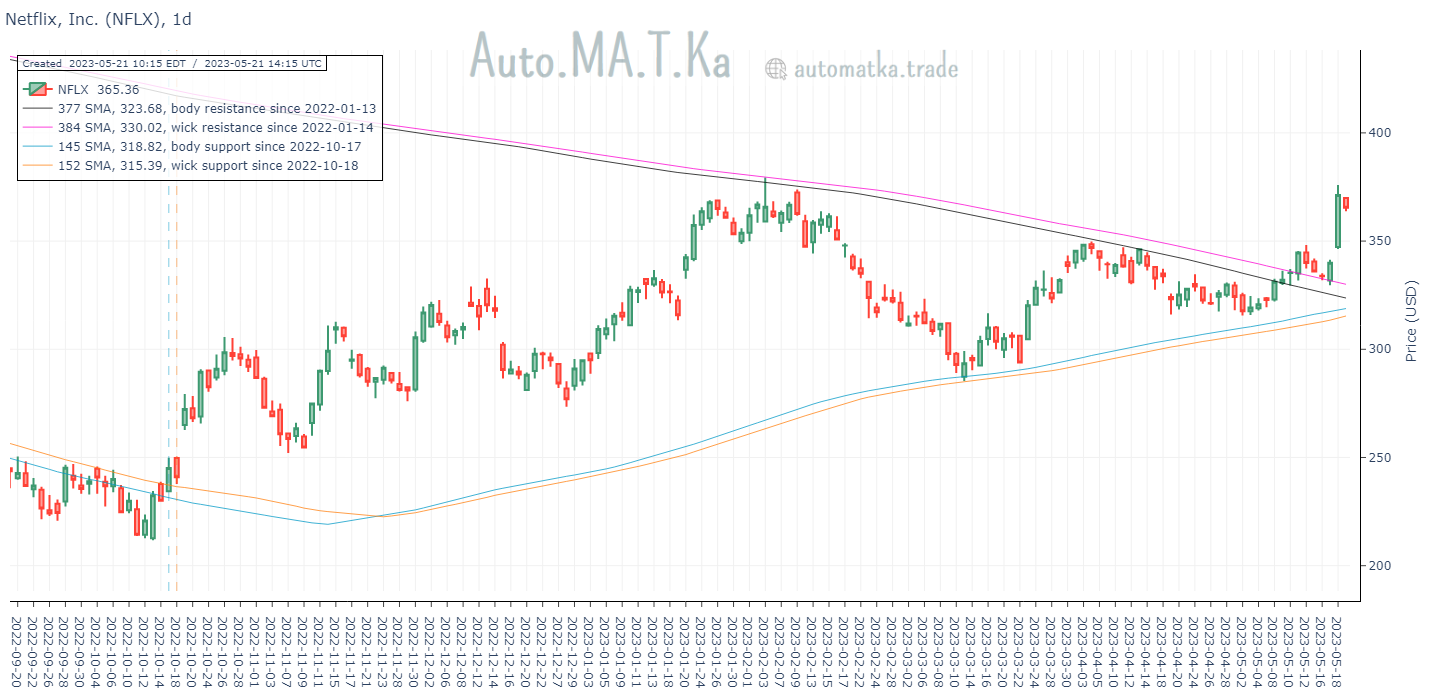
NFLX performed a classic maneuver of coil, break out, retreat to the previous-resistance-now-support line, and a strong move back up, signaling a break out confirmation.
The resistance lines in subjects were the 377-day SMA body resistance line and the 384-day SMA wick resistance line, both registered in early January 2022.
NFLX broke out strongly on the weekly time frame as well:
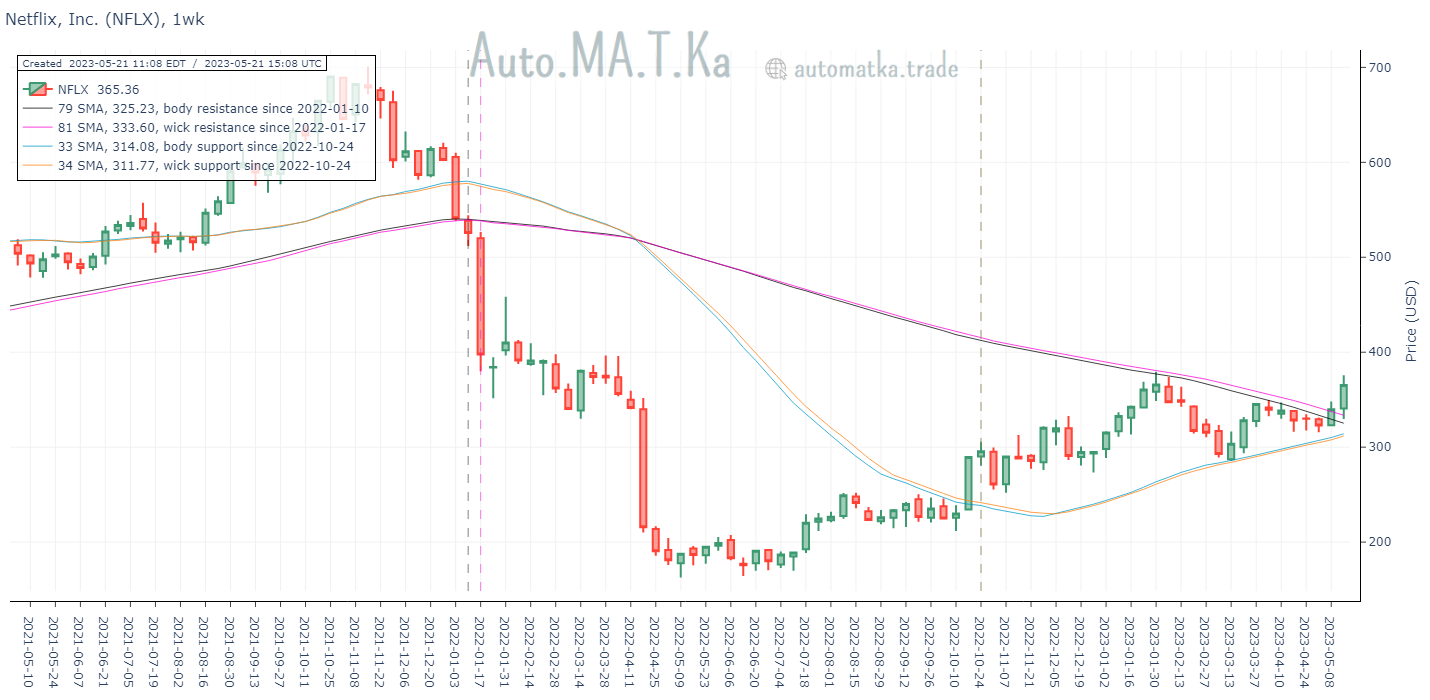
The resistance lines involved with the weekly time frame are the 79-week SMA (body) and the 81-week SMA (wick). Similar to the daily resistance lines, both weekly lines registered in early January 2022.
2023-05-29 Update
Another trading week has gone by and NFLX continued its break out. Here’s a visual of the updated weekly chart, overlaid with the same best respected moving average support and resistance lines that participated in the above post (found on Monday, 8 May 2023):

2023-06-04 Update
A picture is worth a thousand words.
NFLX continued its strong break above its 79-week SMA (body) and 81-week SMA (wick) resistance lines:

Pay attention to the meeting between the support lines and the resistance lines.
2023-06-11 Update
Netflix’s breakout proves to be super powerful, as it kept trading up each week for 4 weeks since it first cracked its best respected weekly moving average resistance lines.
Here is the updated weekly chart:

It is now confirmed that the original support lines crossed above the original resistance lines.
2023-06-25 Update

2023-07-02 Update

2024-05-12 Update
It has been a year since NFLX broke above its best respected moving average resistance lines, the 79-week SMA and the 81-week SMA. In that year, the stock’s price doubled itself:
