Find the BEST Respected Moving Average Support & Resistance Lines

Tesla (TSLA) to $800?

The long term 227 day SMA support line is waiting there, around $800. Post earning TSLA is heading in that direction

TSLA released its 21Q4 earnings report yesterday after the market closed.

Today the stock is being sold and as of this writing, it is down 8% with the lowest price of $857.9.

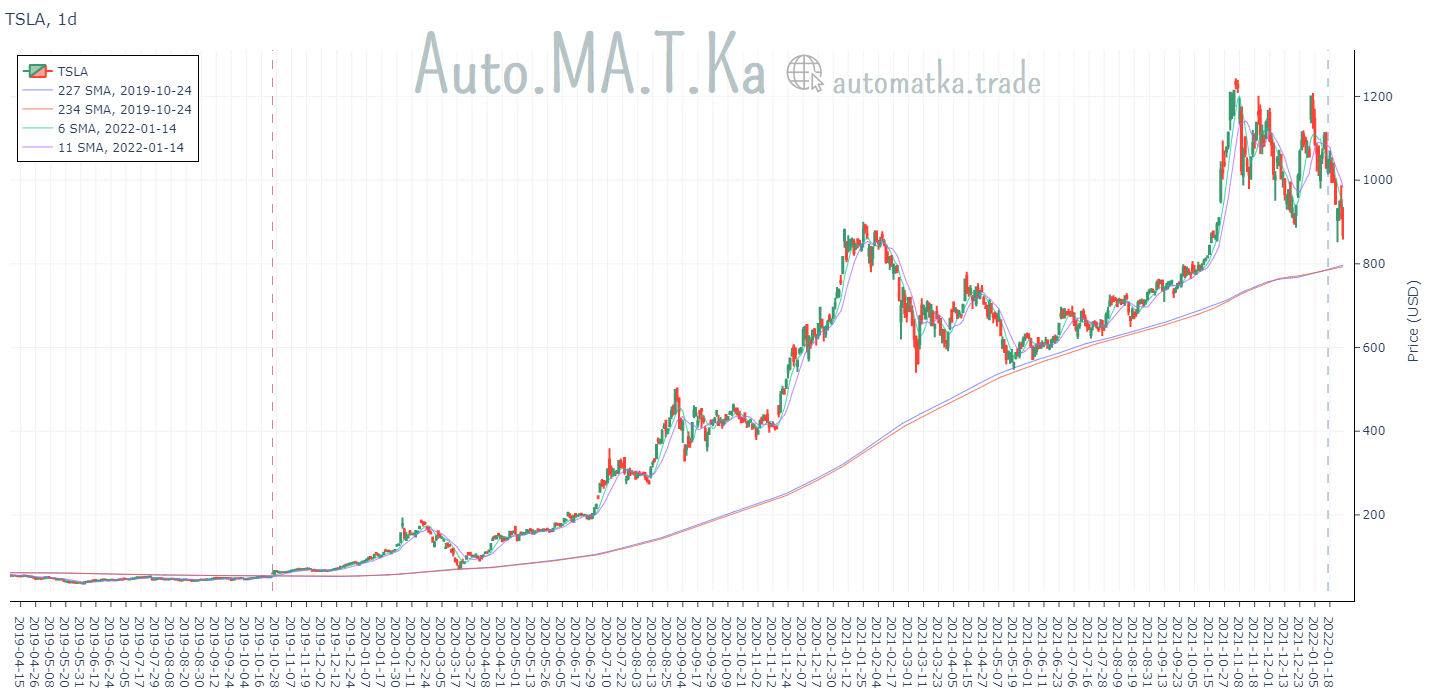
The long term 227 day SMA support line we’re watching is “waiting” around $800 (right now it is at $796.94).

The long term 227 day SMA support line is waiting there, around $800.

Post earning TSLA is heading in that direction:

TSLA, daily chart, Automatka
TSLA, daily chart

Zooming in:

TSLA, daily chart, Automatka
TSLA, daily chart

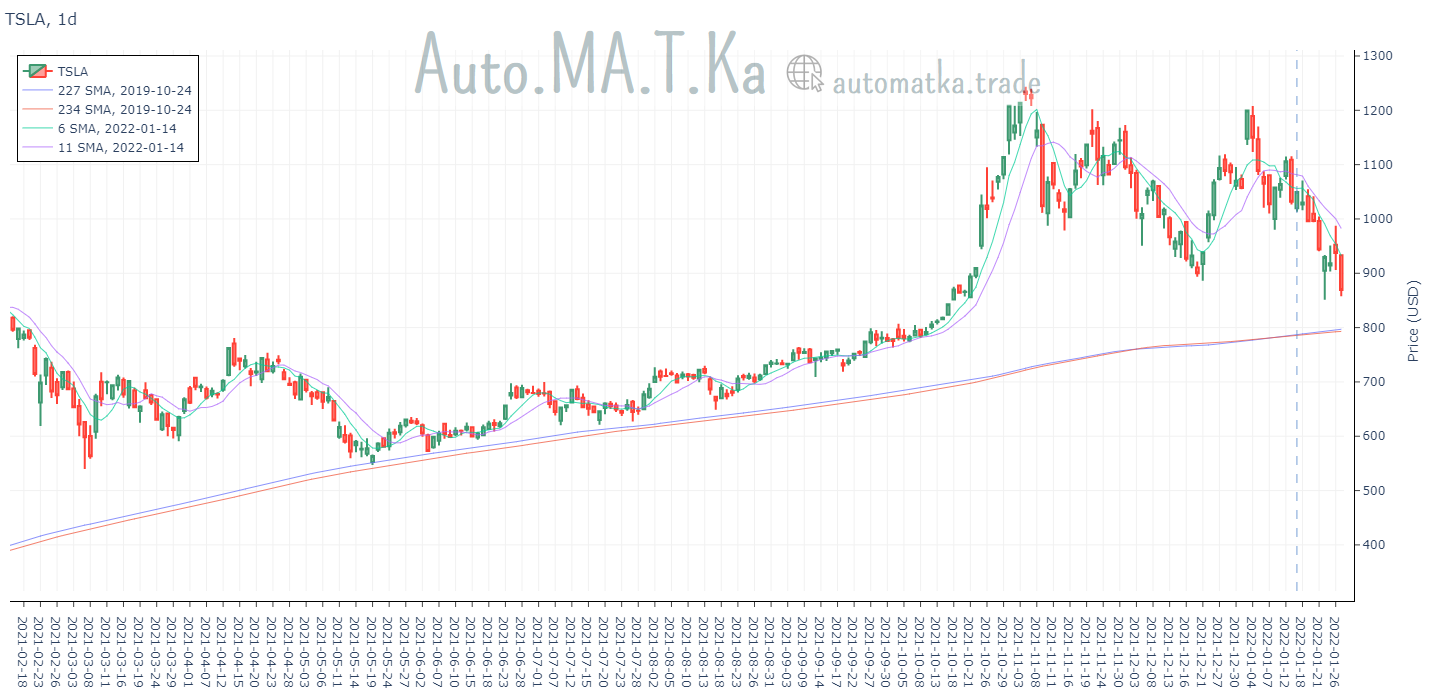
Are big buyers waiting around $800? Potentially yes. Let’s keep watching.

UPDATE

Here are the charts after the market closed. $TSLA ended the session at $829.10 and the 227 day SMA set foot at $796.76.

TSLA, daily chart, Automatka
TSLA, daily chart

Zooming in:

TSLA, daily chart, Automatka
TSLA, daily chart

Auto.MA.T.Ka helps you find the BEST Respected Moving Average Support & Resistance Lines.

Follow us on Twitter to be notified when we publish new posts.

Try us out with your stock symbol.

Thank you for reading!

Leave a Reply

Your email address will not be published. Required fields are marked *